|
One of the more popular new developments this year is the OZQoC Chart (Pronounced "Oz Coke"), which is a handy visual representation of how players are being used. At a glance it's an easy way to understand the roles assigned to each player so we have the context in which to study their statistics.
To accomplish this, OZQoC charts combine two simple concepts on the x and y axis respectively:
1. Offensive Zone Starts (OZ), the percentage of shifts a player starts in the offensive zone
2. Quality of Competition (QoC), the average strength of a player's opponents.
OZQoC charts were first developed this June for the Winnipeg Jets at Arctic Ice Hockey and explained in far more detail over at Flames Nation, where it's part of a weekly statistical summary feature. Since then, it's been used to add objective clarity to debates, like the preseason Derek Dorsett vs. Jared Boll debate over at Jackets Cannons, for example.
There are a few variations out there, including
Mike Rogers' take on Detroit, Corey Sznajder for the Carolina Hurricanes and and Eric's Philadelphia Flyers take over at Broad Street Hockey, which includes sized, colored bubbles—a variation recently adopted by Derek Zona at Copper and Blue and Silver Seven Sens and may become the new standard. It's always exciting when a new creation takes off!
Using an OZQoC chart, we can see which of this year's leading scorers are fighting through the toughest minutes, and which ones are highly dependent on easy, offensive-minded assignments. We've included a player's Corsi percentage next to their name, which is simply a shot-based approximation of how often their team has the puck when they're on the ice for everyone outside the main pack.
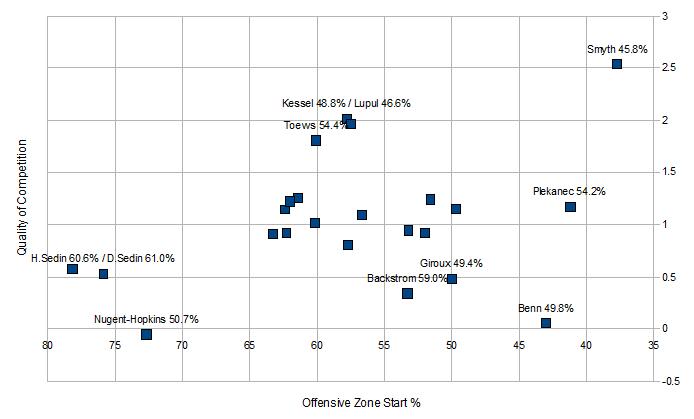
Playing on a young and inexperienced team, veteran Ryan Smyth has been relied upon for most defensive-zone faceoffs against Edmonton's top opponents, so it's no embarrassment to have a low Corsi percentage, and quite the feat to be among the scoring leaders.
We're also impressed with Montreal's Tomas Plekanec, who joins Smyth as one of only five leading scorers to start the majority of their shifts in the defensive zone (Jamie Benn, Claude Giroux and Steven Stamkos are the others), and the only one among them to actually enjoy territorial advantage, and decisively at that.
Jamie Benn is playing very well, but while it's typical for leading scorers to see most of their ice-time against the top lines, his coach's protection has kept him around the average mark, below Nicklas Backstrom, Claude Giroux, and the Sedins, ahead of only rookie Ryan Nugent-Hopkins. It's important to recognize that players like Radek Dvorak, Michael Ryder, and Vernon Fiddler are facing the top opponents for the Dallas Stars so that that Jamie Benn has the room to score.
It's no surprise to see the Sedins in the lower left-hand portion of the chart given that their sky-high scoring these past three seasons is a result of the deliberate choice by coach Alain Vigneault to have players like Manny Malhotra and Ryan Kesler play the truly agonizing minutes so that the Sedins can be used whenever possible in the offensive zone or against the depth lines—a system that is quickly becoming the NHL norm.
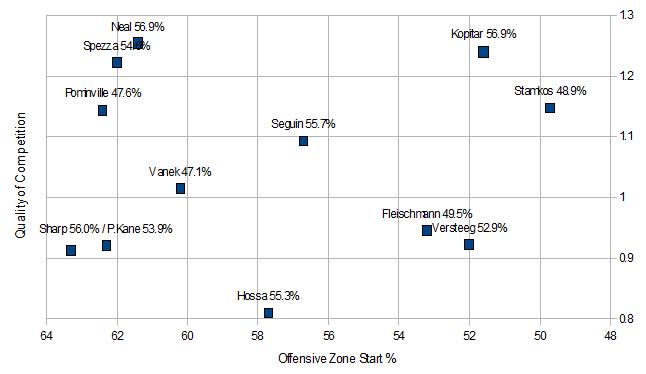
Despite the Sedins' prolific scoring these past few seasons, it's hard to not to be more impressed with a fantastic two-way forward like Jonathan Toews, who can score almost as much in almost any situation. Coach Joel Quenneville trusts him against the top lines slightly more than his other star players Patrick Kane, Patrick Sharp, and Marian Hossa, which you can see for yourself when we zoom in to the players in the middle of the pack.
Final Word
In the world of hockey analytics, we always strive to break down the complexity of the sport into simplicity. Despite its infancy, OZQoC charts and their variants are already in use at a number of top analytical hockey sites because of how well it achieves that end.
To add OZQoC charts to your own site, grab the raw data from
Behind The Net, drop it into a spreadsheet, create a scatter (or bubble) graph, and find out at a glance which players are logging the tough minutes in their own zone against top competition—like Ryan Smyth—or cruising around in the offensive zone against less elite competition, like Ryan Nugent-Hopkins or the Sedins.
Robert Vollman is an author of Hockey Prospectus.
You can contact Robert by clicking here or click here to see Robert's other articles.
|  0 comments have been left for this article.
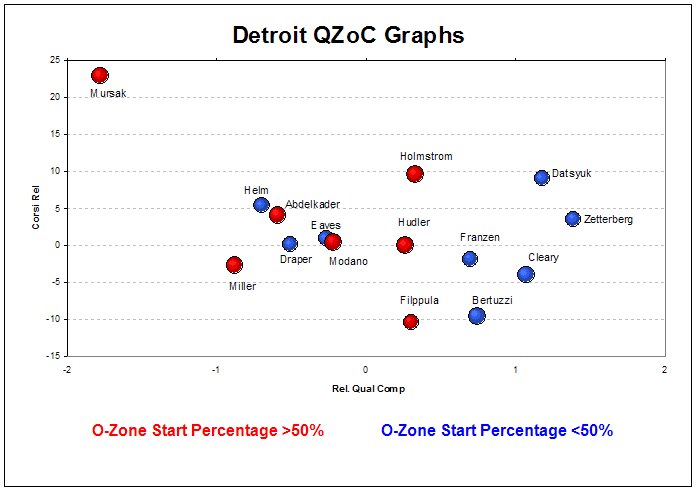