|
Relief goaltending has always fascinated me, or at least the lack thereof. Unless things go extremely badly for them, starting goalies never get a single break, not even after an extended and exhausting penalty kill or after getting run down by power forwards. Two years ago, in this article, we discovered that goalies are relieved in only 7% of NHL games, and in general only after stopping fewer than 80% of the shots while allowing three or four goals. That unfortunately leaves us with an awfully small sample size.
Best relief goalies, 2007-Present
Goalie            GR  GAA  SV%
Josh Harding      15 1.34 .953
Scott Clemmensen  11 1.90 .934
Joey MacDonald    10 2.06 .931
Antero Niittymaki 13 1.96 .929
Brent Johnson     15 1.91 .916
Mathieu Garon     21 2.23 .914
Jonas Hiller      17 2.06 .913
Craig Anderson    10 2.79 .911
Jose Theodore     10 2.33 .907
Martin Biron      10 2.33 .907
Minimum 10 GR
One of the reasons goalies aren't relieved is because they don't play as well when they're cold. 28 goalies have relieved the starting goalie at least 10 times in the past four seasons, and of them, only nine were better in relief than they were as a starter. As a weighted group, their save percentage dropped from .9067 to .9008 in relief. Take Mike Smith and Josh Harding for example, both of whom have .907 save percentages as starters, but Smith is .862 in relief, the biggest drop, and at the other end, the great Josh Harding improves to .953 in relief, the biggest leap.
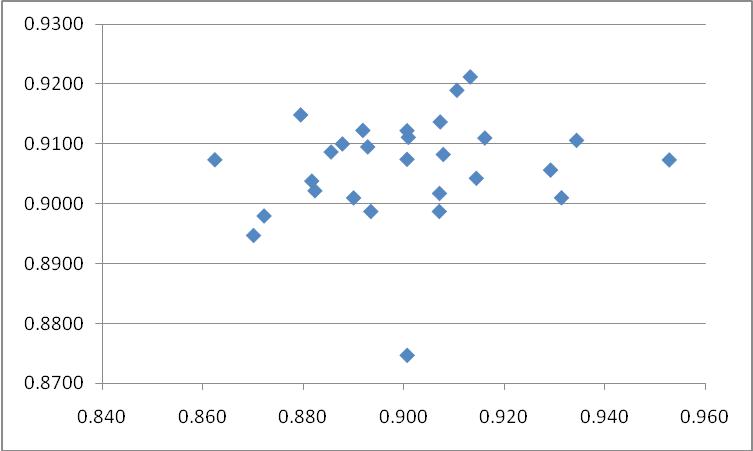
The correlation between save percentage in relief and save percentage as a starter is just 0.16. To put the lack of correlation in a more visible format, here's a graph with relief save percentage on the x-axis and as a starter on the y-axis. By the way, that's Curtis Joseph at the bottom, Josh Harding on the far right and Mike Smith on the far left.
If relief goaltending were a true skill, one's save percentage in relief would correlate from year to year. For example, among starters who played at least 2000 minutes for two consecutive seasons, between 2007-08 and 2010-11, the correlation between save percentage one year to the next is 0.14, and the graph looks like this.
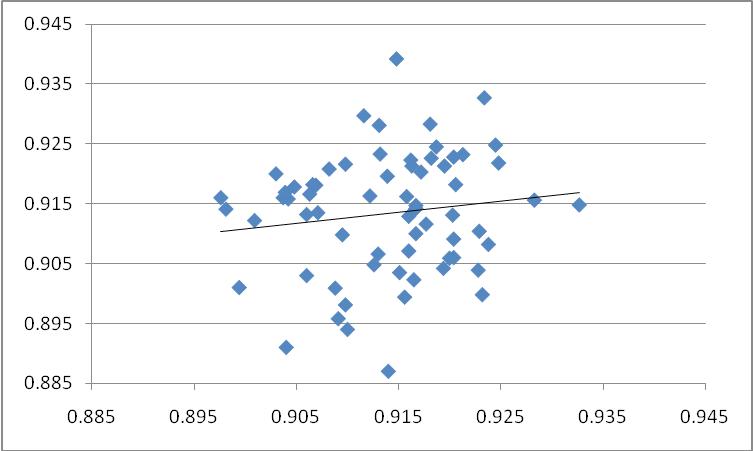
On the very bottom you have Chris Osgood, who went from .914 as a starter in 2007-08 to just .887 in 2008-09, and at the top Tim Thomas, of course, who just this season went up from .915 to .939.
The correlation improves somewhat if you regress save percentages to the mean, peaking at a correlation of 0.23 if you regress it 90% to league average. In fact, the league average save percentage is more closely correlated to a goalie's save percentage (0.19) than his save percentage from the preceding season (0.14). If that's the case with a starter's save percentage, the tiny sample sizes of relief goaltending will be completely useless.
Interestingly, relief save percentages have a negative correlation from year-to-year, even if you regress it to the mean. Looking at those who played at least a paltry 120 minutes in relief in consecutive seasons since 2007-08—and there are only 21 such data points—the correlation in save percentage is actually -0.42, a strong negative correlation. The data certainly suggests that if you're good in relief one season then you're bad the next, and vice versa! Check it out in visual form.
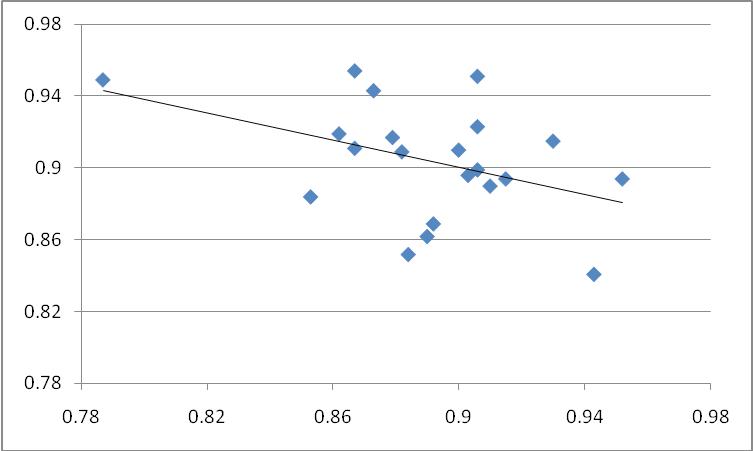
In all, 14 of the 21 sample points swung from one side of league average to the other. On the far left, you have Andrew Raycroft, who improved from .787 to .949 from 2008-09 to 2009-10, and in the bottom right you have Johan Hedberg, who declined from .943 in 2009-10 to .841 last season. It's a pity that the sample size is too small to draw any meaningful conclusions, but it sounds like MacDonald, Clemmensen and Raycroft are in for a crash, and Hedberg a jump.
As always, email me if you'd like a copy of the data.
Robert Vollman is an author of Hockey Prospectus.
You can contact Robert by clicking here or click here to see Robert's other articles.
|  0 comments have been left for this article.